

In this survey there are included patients, they were visiting a certain doctor´s office in the year 1999. The next criterium was, that they got at least a minimum of ten treatments of Electroneural-Therapy and the therapy must also be finished with a Electroneural Somatogram documentation.
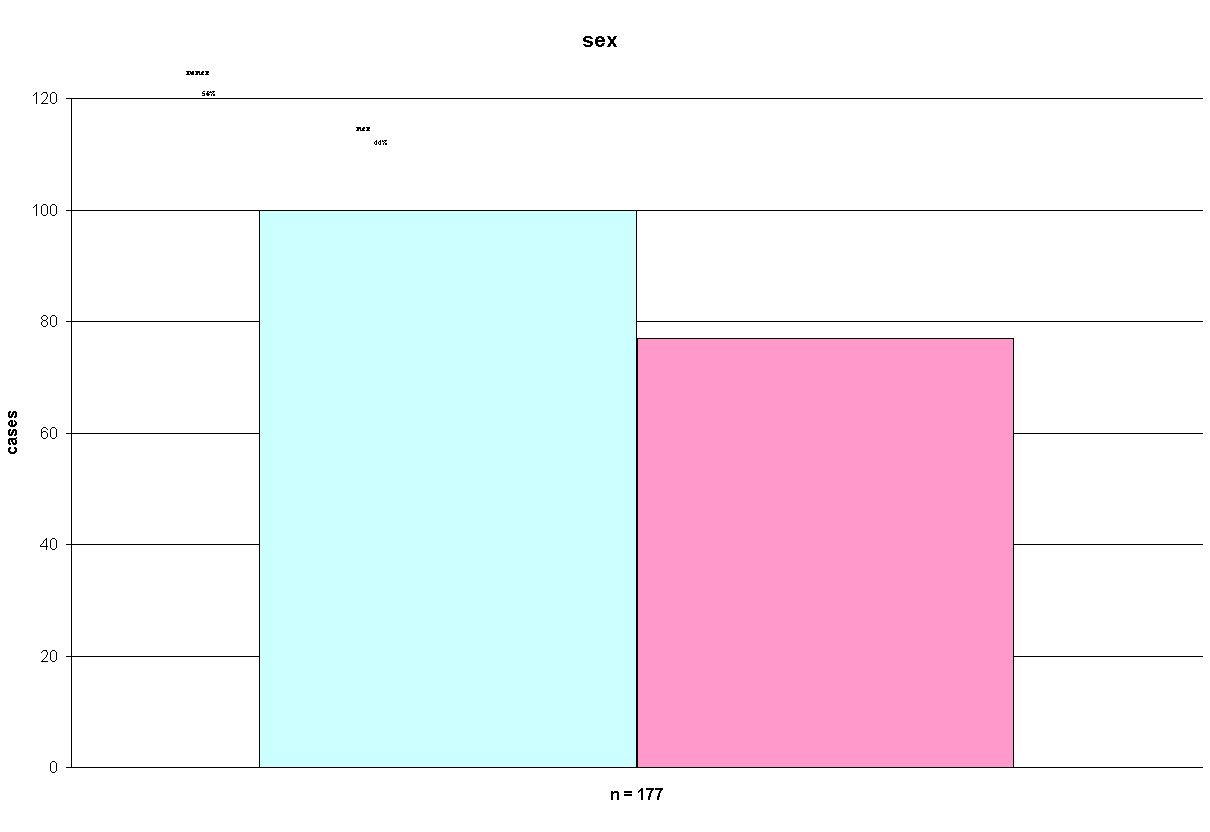
There were 177 cases together they were analysed. The group of patients consist of 100 women and 77 men.
The average results of the Electroneural-Somatograms from these patients
at the beginning of the therapy were compaired with final results at the
end of therapy.
There were made exactly 506 electroneural somatograms which are including in this survey. All somatograms were made out by Neuropont 7 device of the Elektroneural AG, Roosstr. 53, CH 8832 Wollerau, Switzerland.
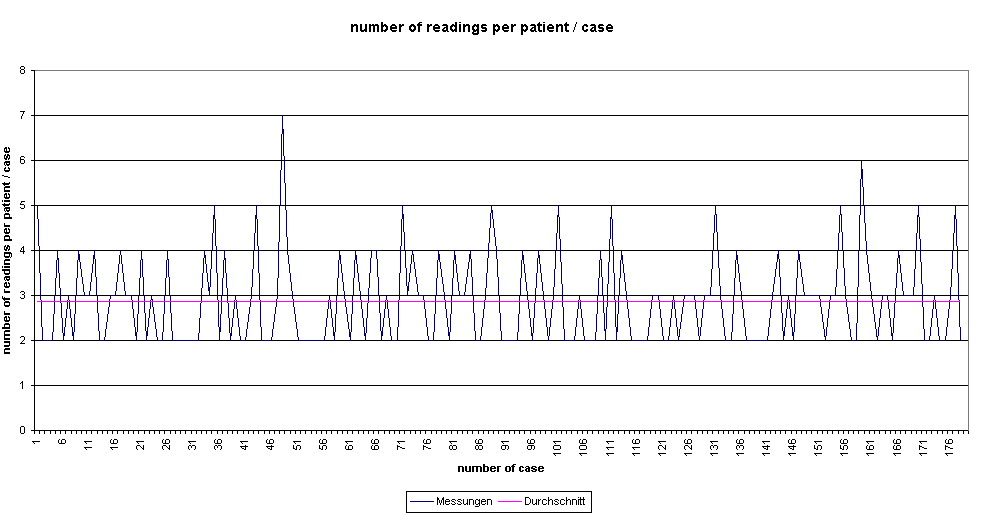
In average there were read up 2,85 electroneural somatograms per patient. So there were in minimum 2 in maximum 7 elctroneural somatograms per patient.
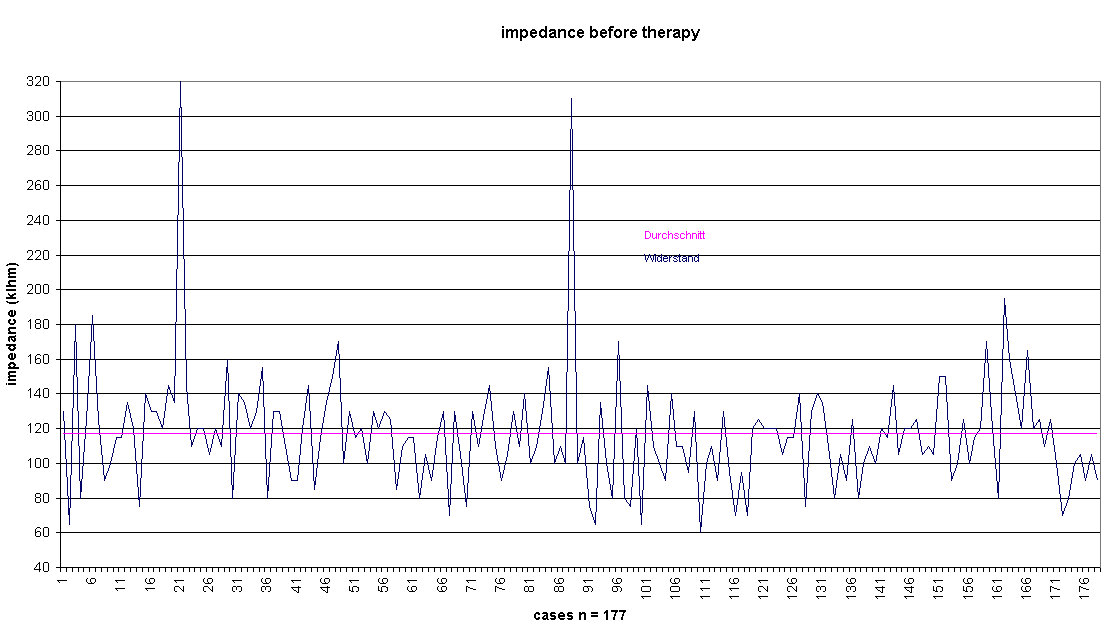
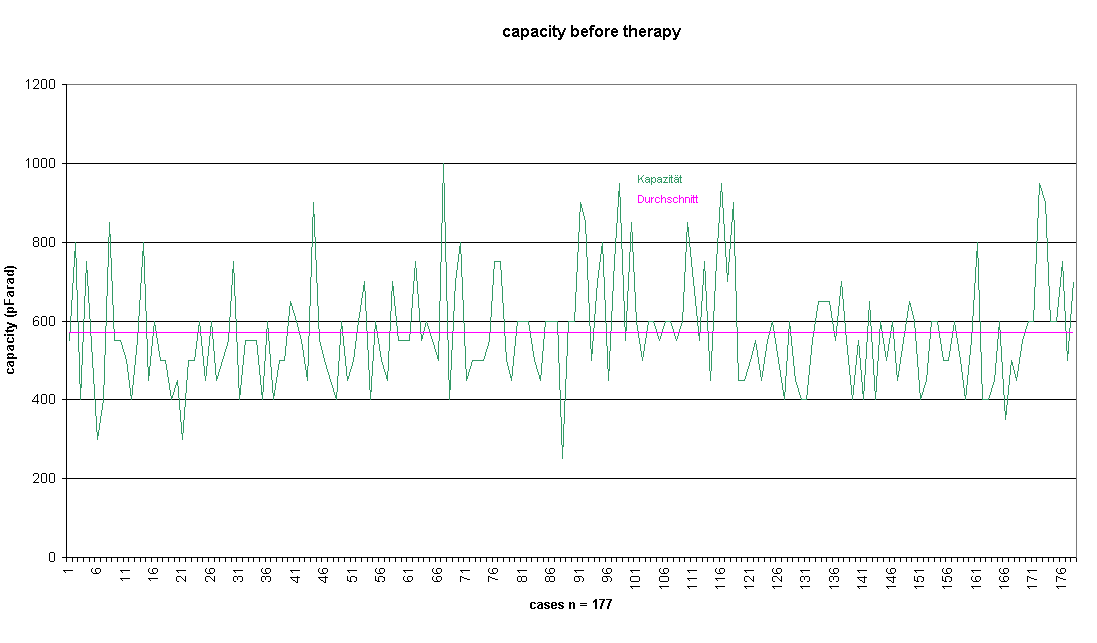
The worst and the best values of impedance and capacity were determined.
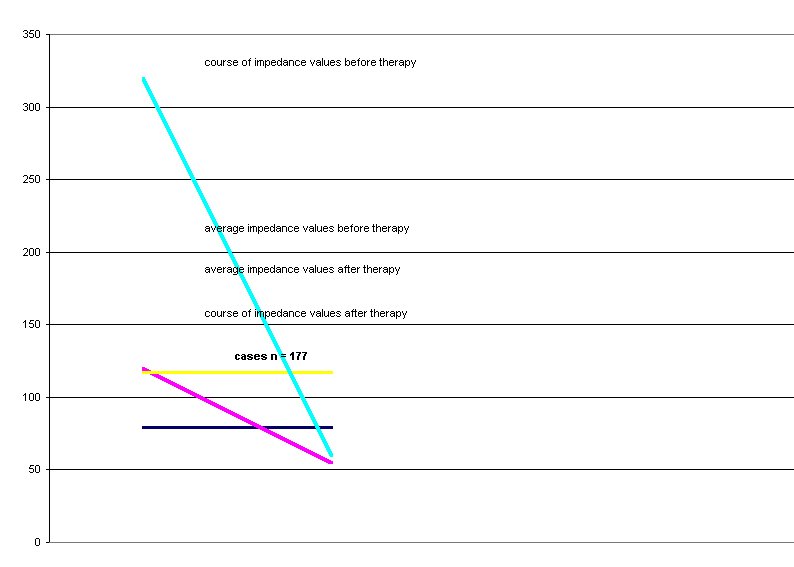
So we got the worst value at 320 kOhm and 300 pFarad, the best at 60 kOhm
and 850 pFarad at the beginning. The average of all of the values was 117
kOhm and 572 p Farad before therapy.
The treatments follow ersued in span from 10 to 60 aplications and were implemented by Perductor 7 of Elektroneural AG, adress see above.
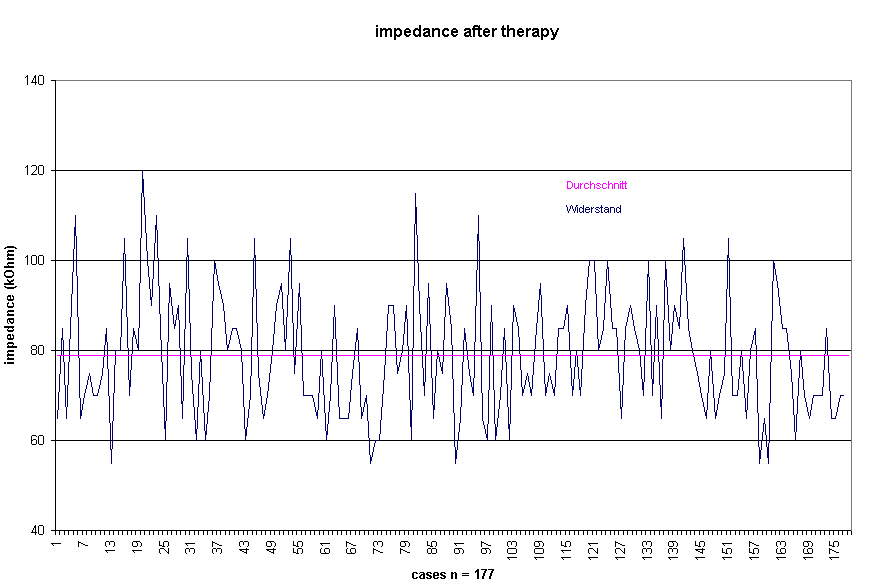
The same areas were registered at the end of the therapy. So the worst value of impedance and capacity was at 120 kOhm and 500 pFarad and the best at 55 kOhm and 1100 pFarad at the end of the therapy. The average of all values was 79 kOhm and 809 pFarad.
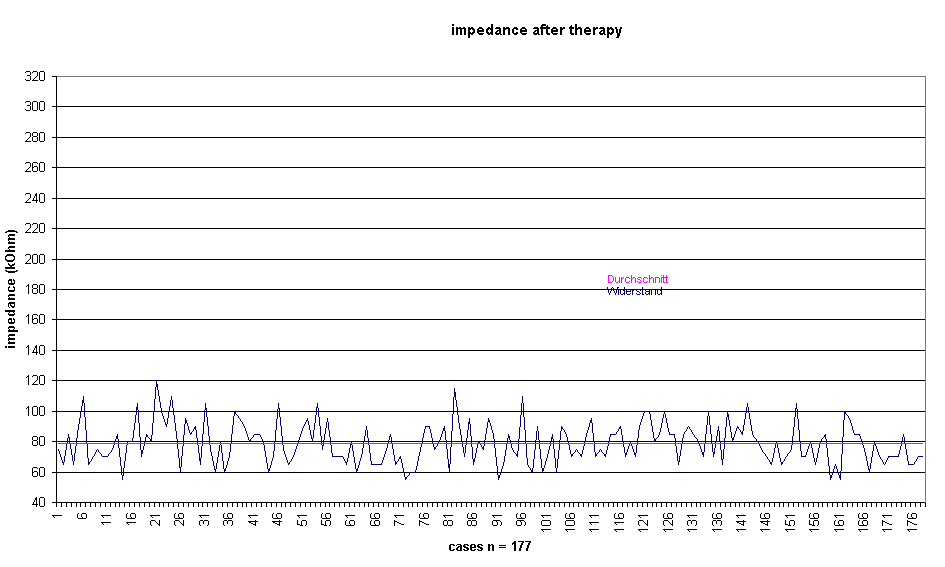
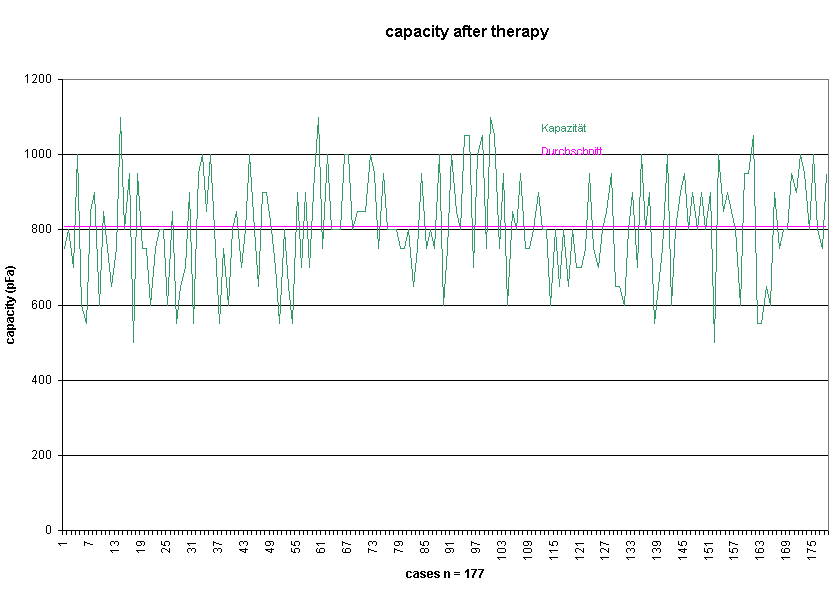
Here is an enlarged diagramm of impedance and capacity after therapy for better view:
The values of impedance and capacity from all patients were compaired at the beginning and at the end of therapy.
So we can say exactly, in how many cases the impedance improved, in how many the impedance did not change and in how many cases the impedance decreased.
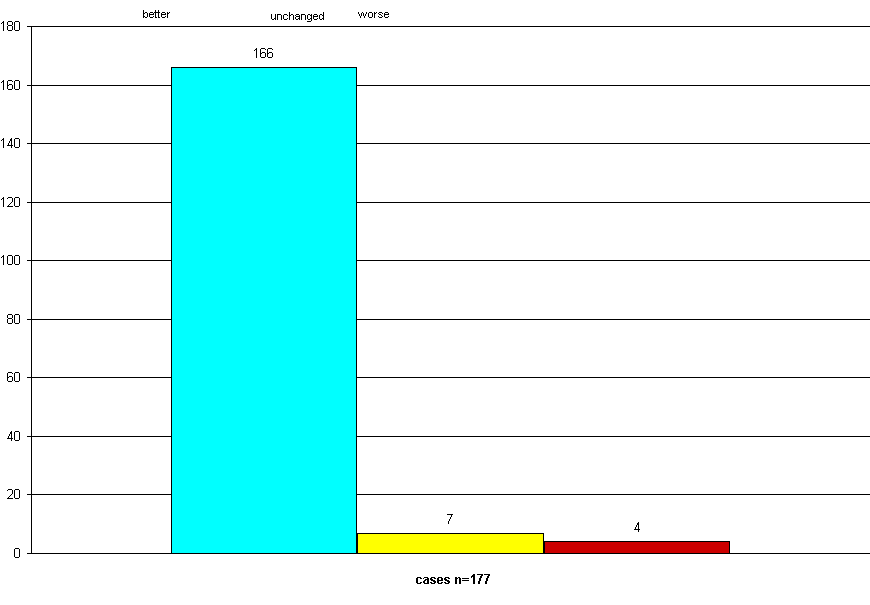
In this way it could be realized, that from the totality of 177 cases
166 improved, 7 had no change and 4 decreased, comparing the impedance
values from the beginning and the end of therapy.
The graphical presentation is the following:
Or presented in a circle diagram:
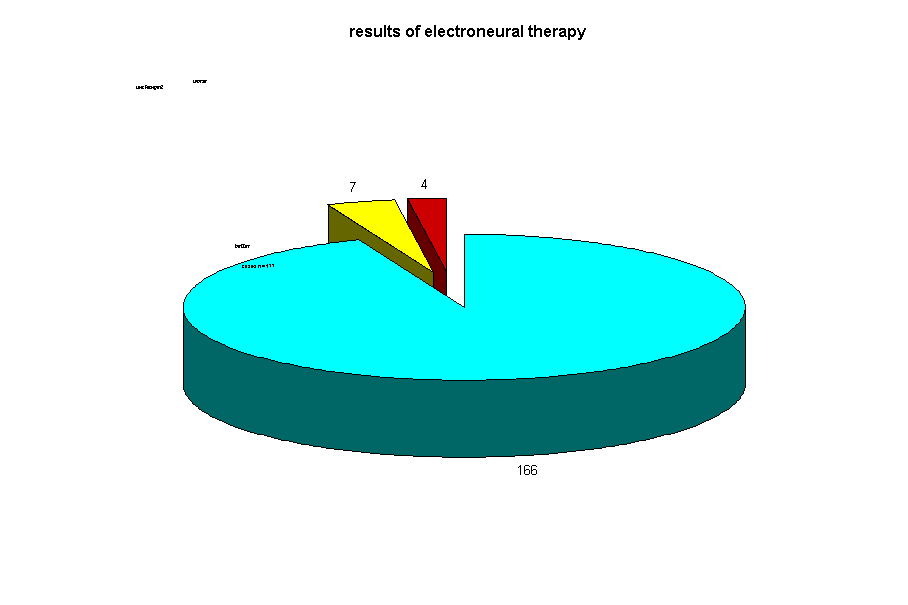
The description in percent shows, the 94% of the cases improved, 4%
were unchanged and 2% decreased.
This success of electroneural therapy is also for us a big surprisse.
We did not take into account such a great result.